Odoo dashboards are valuable tools that provide an overview of your company's statistics by utilizing reports from each module. Every dashboard is built upon a spreadsheet. Odoo employs its own spreadsheets to streamline the process, ensuring everything is interconnected for efficiency.
It's important to remember that you can add various types of information to your spreadsheets. This includes pivot tables, charts, and lists containing the data you need. Additionally, you can insert links directly from any Odoo module that will redirect you to the selected menu.
Odoo provides a variety of default dashboards that can be used as they are or modified.
Important: If you intend to customize a default dashboard, you must duplicate it first. This precaution is necessary because database updates will revert any changes you make to the standard dashboards back to their original settings.
We had a client that didn’t want to use these default dashboards, but instead create new ones.
Request:
''We need a CRM Dashboard with 3 graphs that display the following: the number of opportunities created by week, the expected revenue of those opportunities, and the number of opportunities won by week.''
This can be done in 2 ways:
- Add the graph directly to the spreadsheet; this is a quicker way, but it does not let you customize much.
- Insert a pivot table with the same information into the spreadsheet and create the graphic inside the spreadsheet.
Even though the reports were simple, it is better to add a pivot table with all the information, then create the graphs; this way, you can customize and optimize the information as you wish.
Process
- Inserting the pivot table in the spreadsheet
We started by navigating to the CRM application and accessing the Reporting menu. From there, to meet the client's request for the number of opportunities and their expected revenue, we specifically chose the pipeline report option.
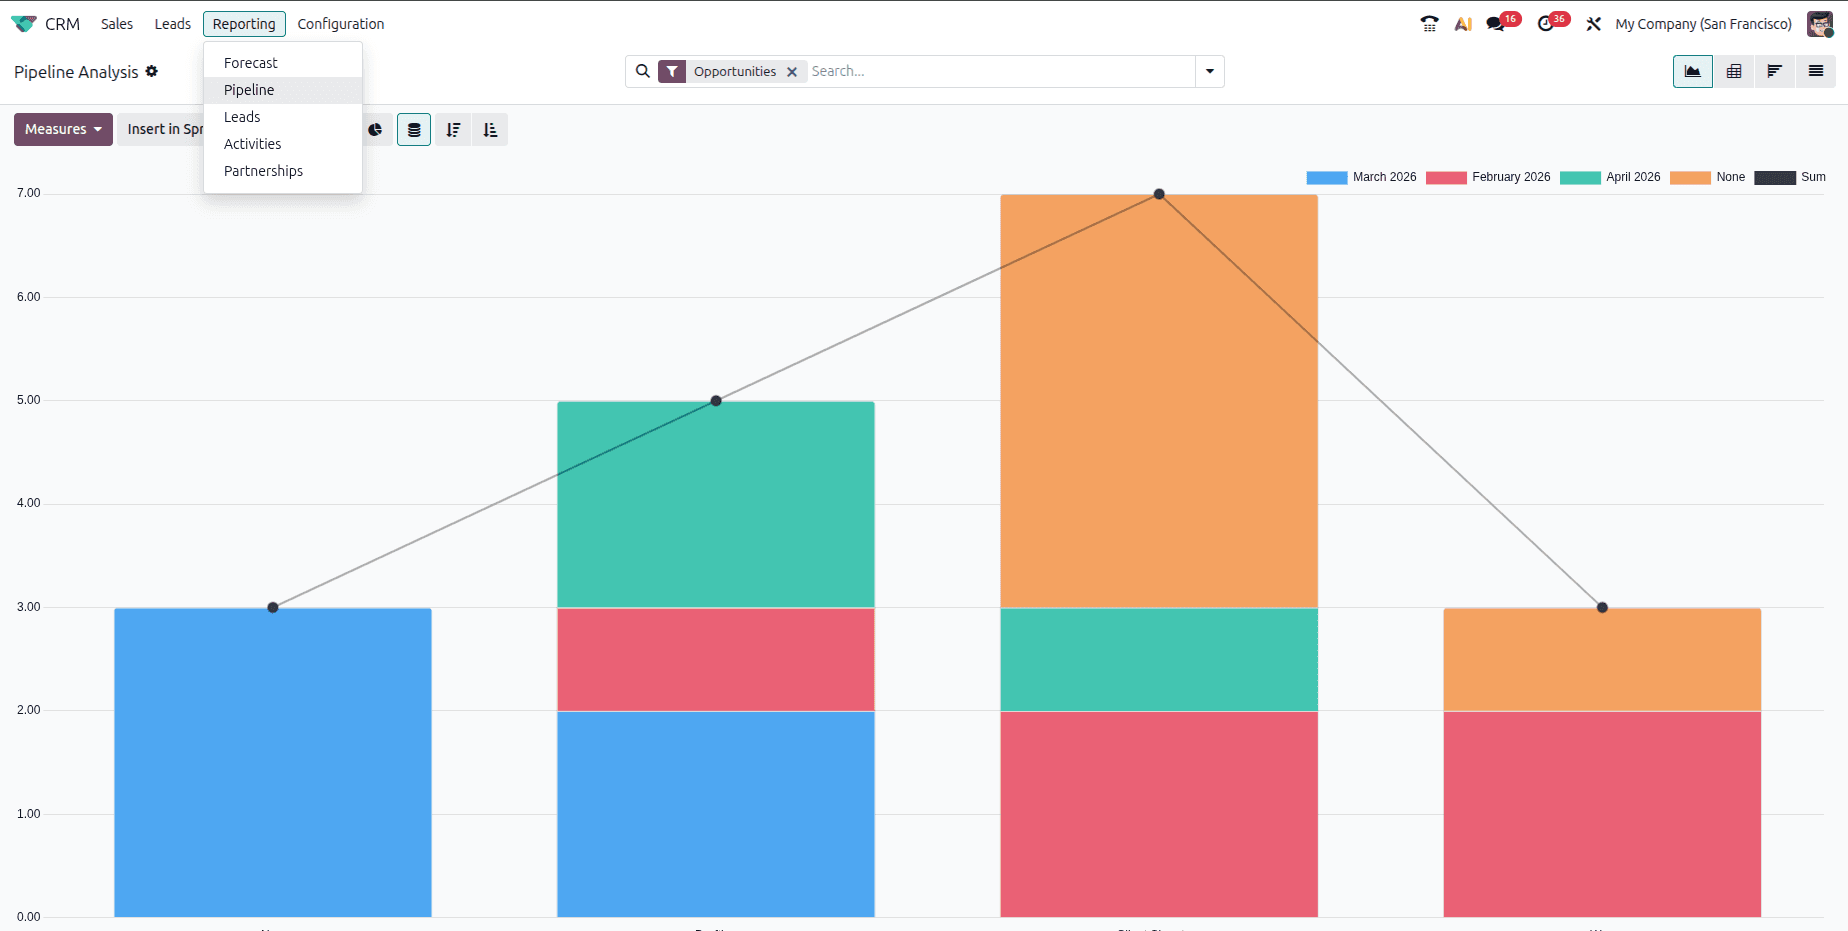
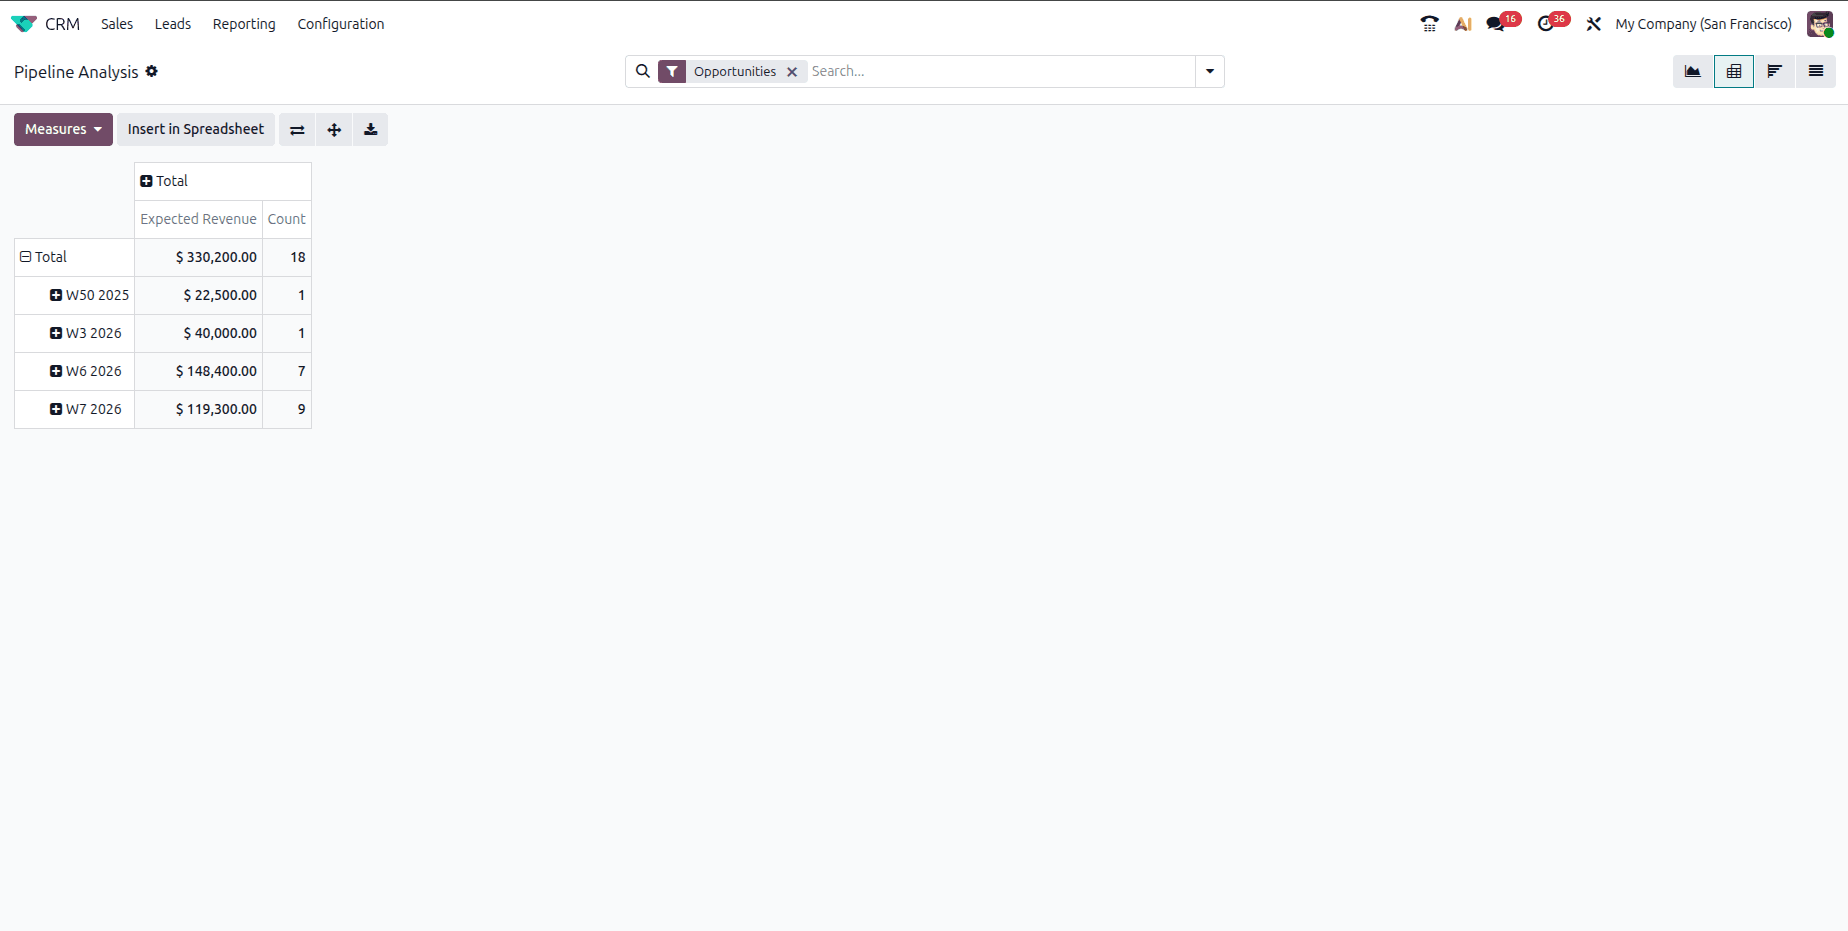
The pivot table can be accessed by clicking the "Pivot" button in the top right corner of the page. Within the pivot table, we configured the data to show the 'Count' and 'Expected Revenue' measurements, and applied a filter to group the results by week.
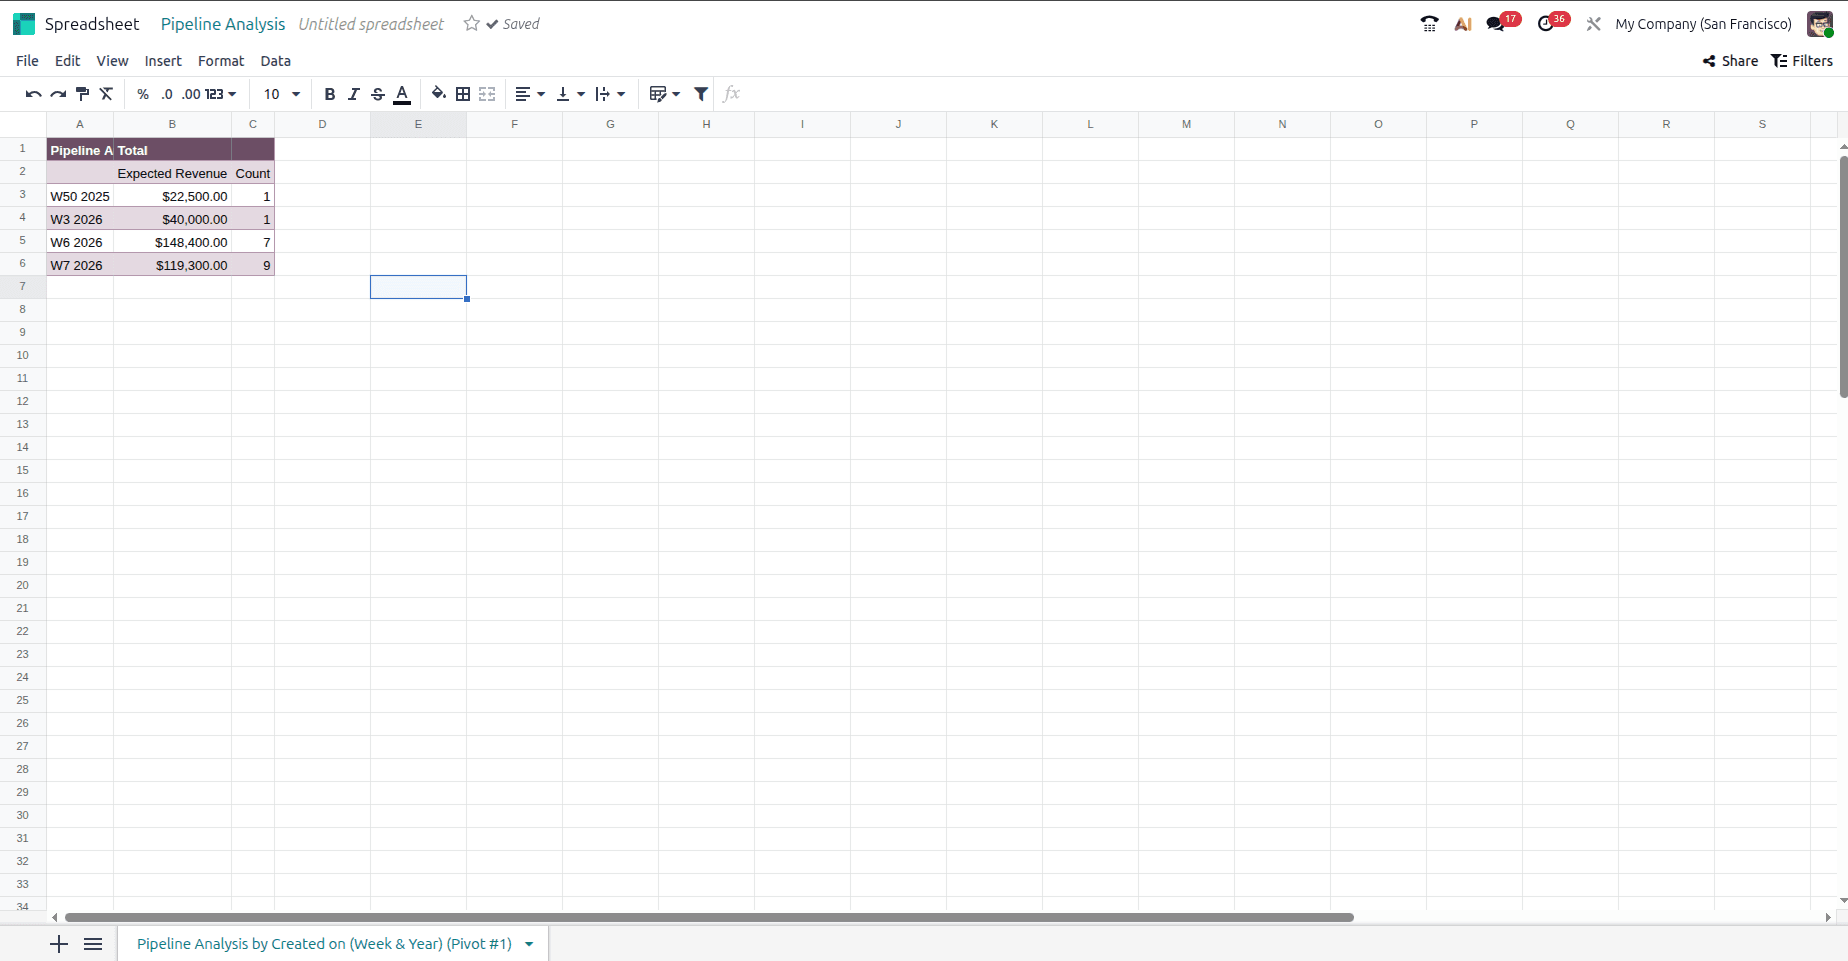
Then we inserted the pivot in the spreadsheet.
Before making changes in the spreadsheet, you must delete the existing pivot table and re-insert it as a dynamic pivot table. This ensures the table will automatically update with new data.
If you check any field belonging to the dynamic pivot, you can see =PIVOT(1), since we din’t want the totals to appear in our graph, we used =PIVOT(1, ,0), which will erase the Total row.
To modify the pivot table, right-click and select Pivot properties. This opens a side menu where you can add or remove columns, rows, and measures.
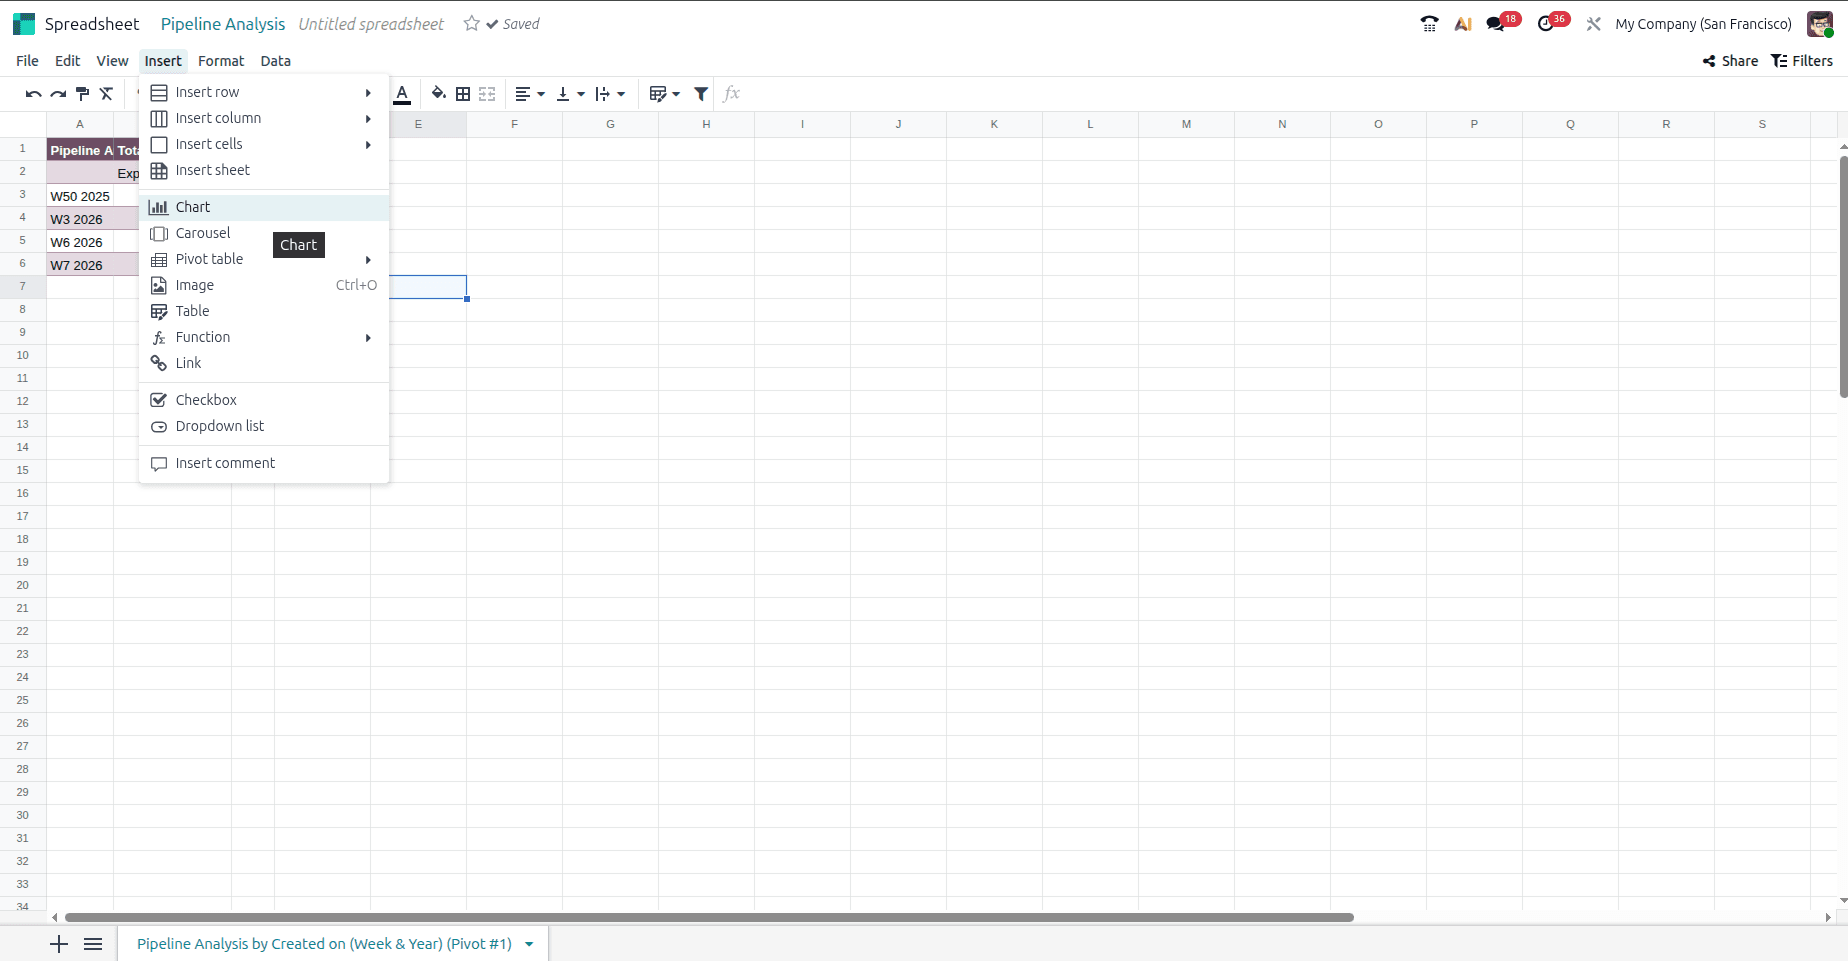
Once the pivot table is set up, you can create your graphs. Click on Insert and select Graph. A blank graph will appear. Configure it by selecting the appropriate cell ranges from your pivot table.
We initially though of using three graphs. To keep the dashboard clean and allow for future additions, we reduced the number of graphs from three to two by utilizing the global filter for the 'Won' stage opportunities.
To construct the first graph, we selected the first cell containing data B3. To ensure the graph updates automatically with the pivot table, the data range must be "infinite," specified as B3:B. The same principle applies to the Categories/Labels; the starting cell is A3, and the range is A3:A.
The process for creating the graph showing the number of opportunities created per week is the same as described above.
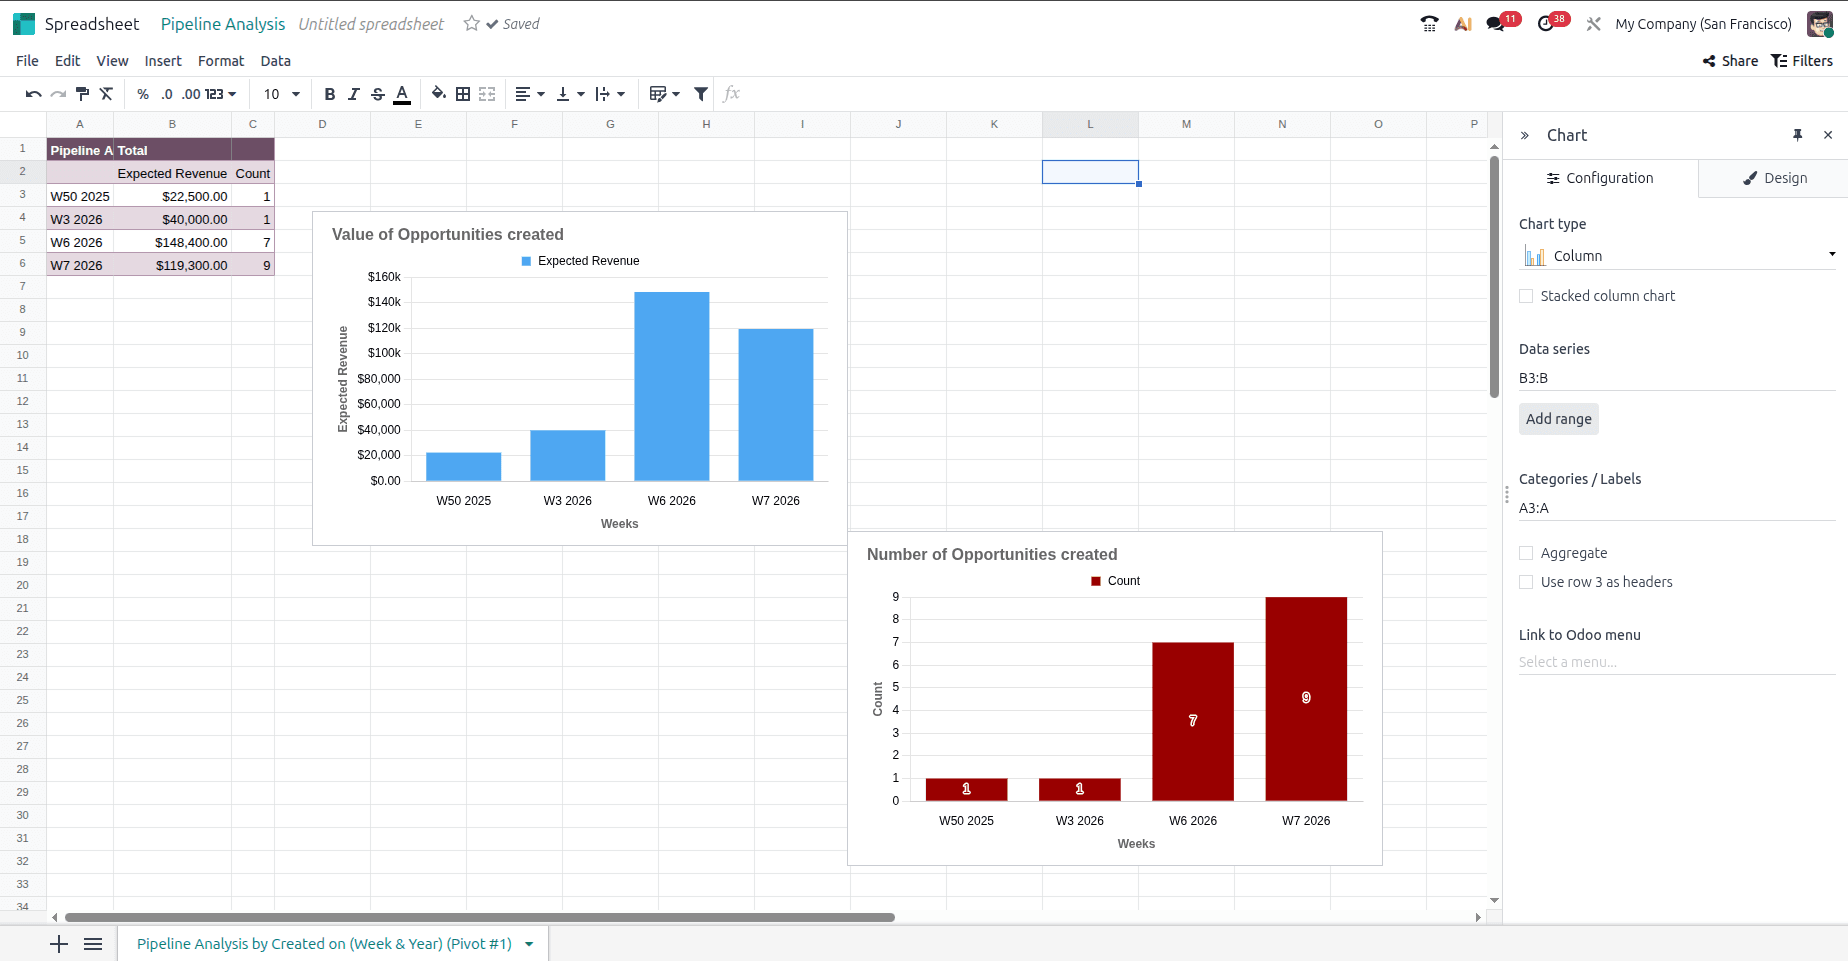
As you can see you have a design tab in the chart options, where you can customize their type, title, color, and axes titles.
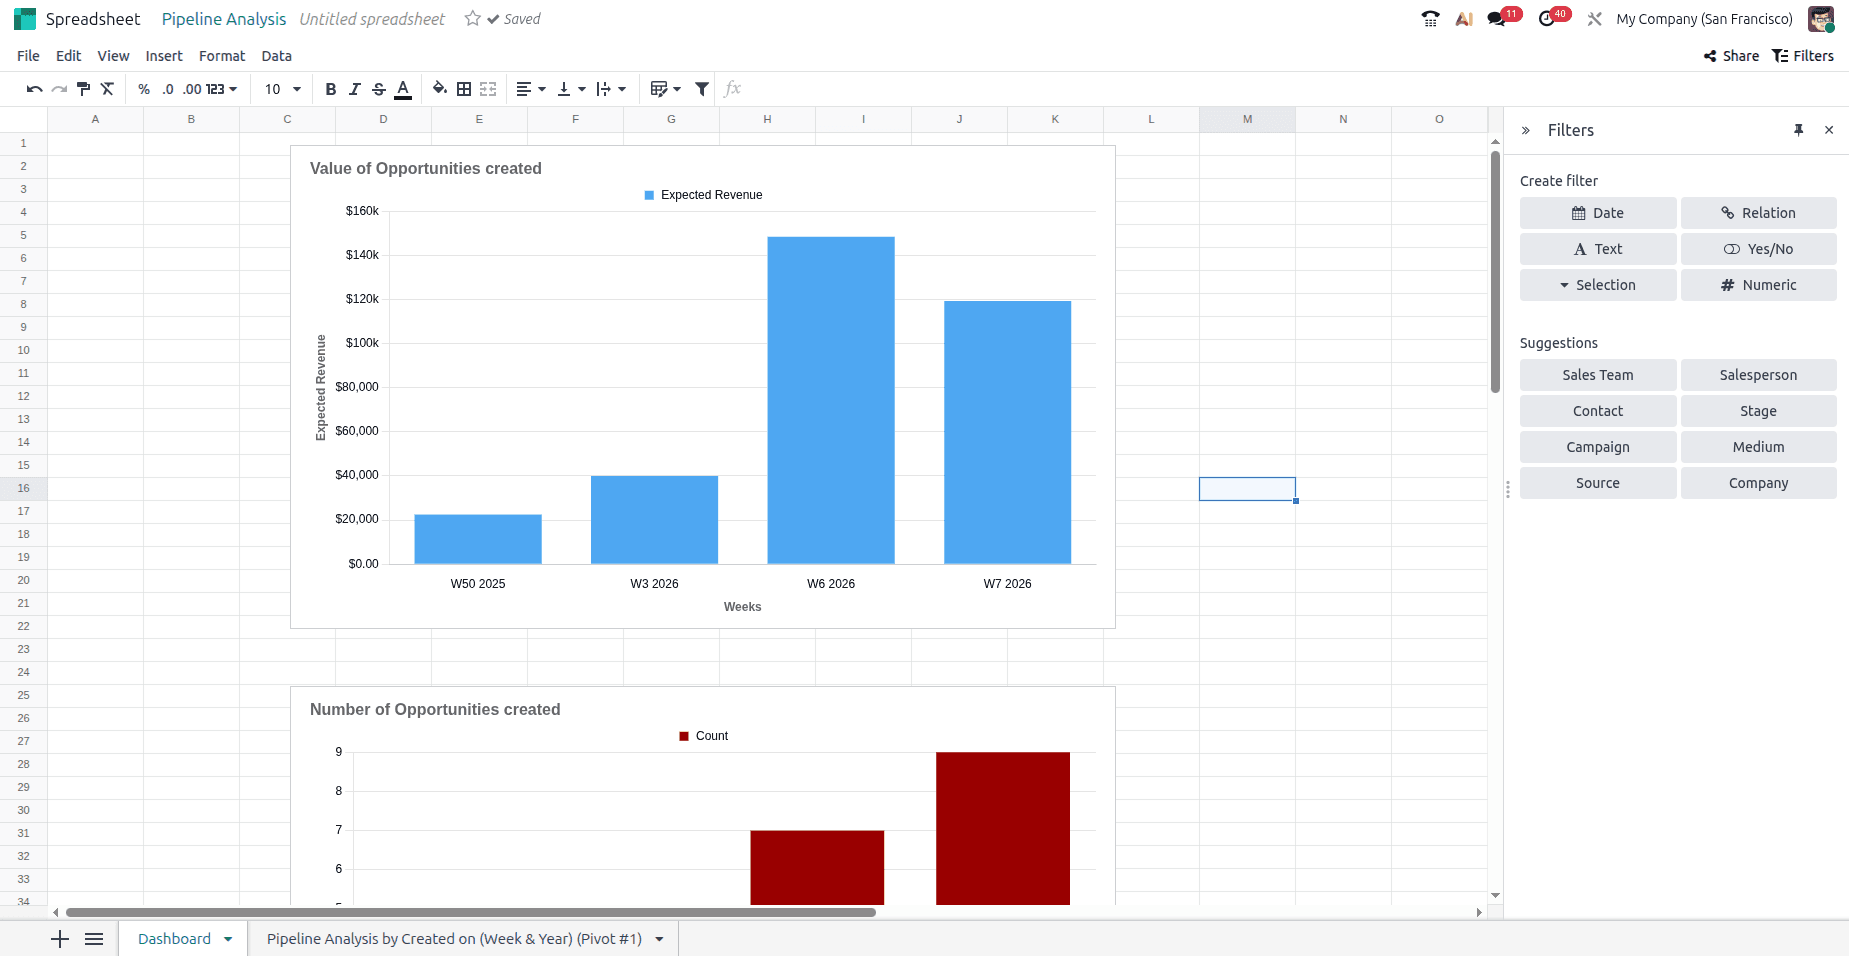
After creating both of these graphs, they were moved into the first sheet of the spreadsheet. This sheet is where the dashboard fetches the data it presents. Now, to get the number of opportunities won this week, we clicked on the Filters button on the top right corner. This opened a list of filter options, some of which are suggestions of filters based on what was created in the spreadsheet.
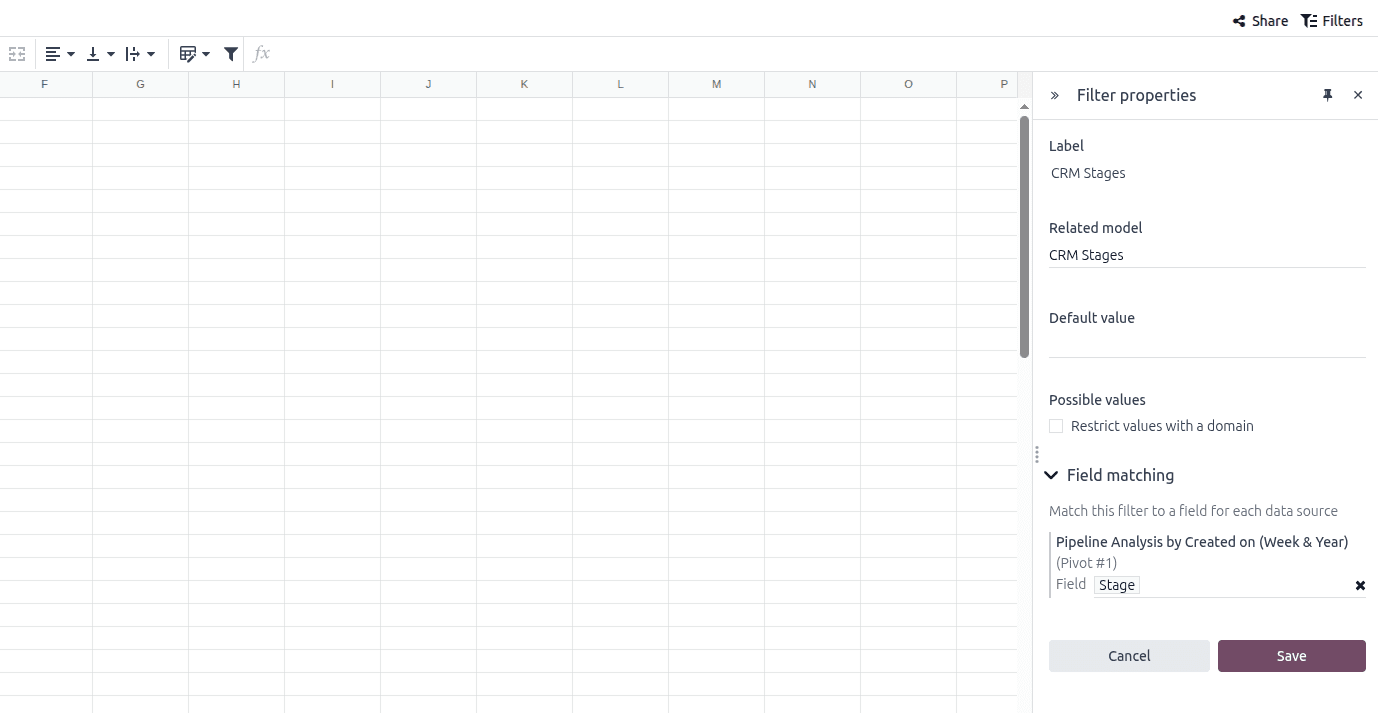
The field we were looking for was a relation field with the related model: CRM Stages, and to make it work, we scrolled down to the field matching where we could see the name of the pivot inserted in the spreadsheet, and here we linked it to the field: Stage.
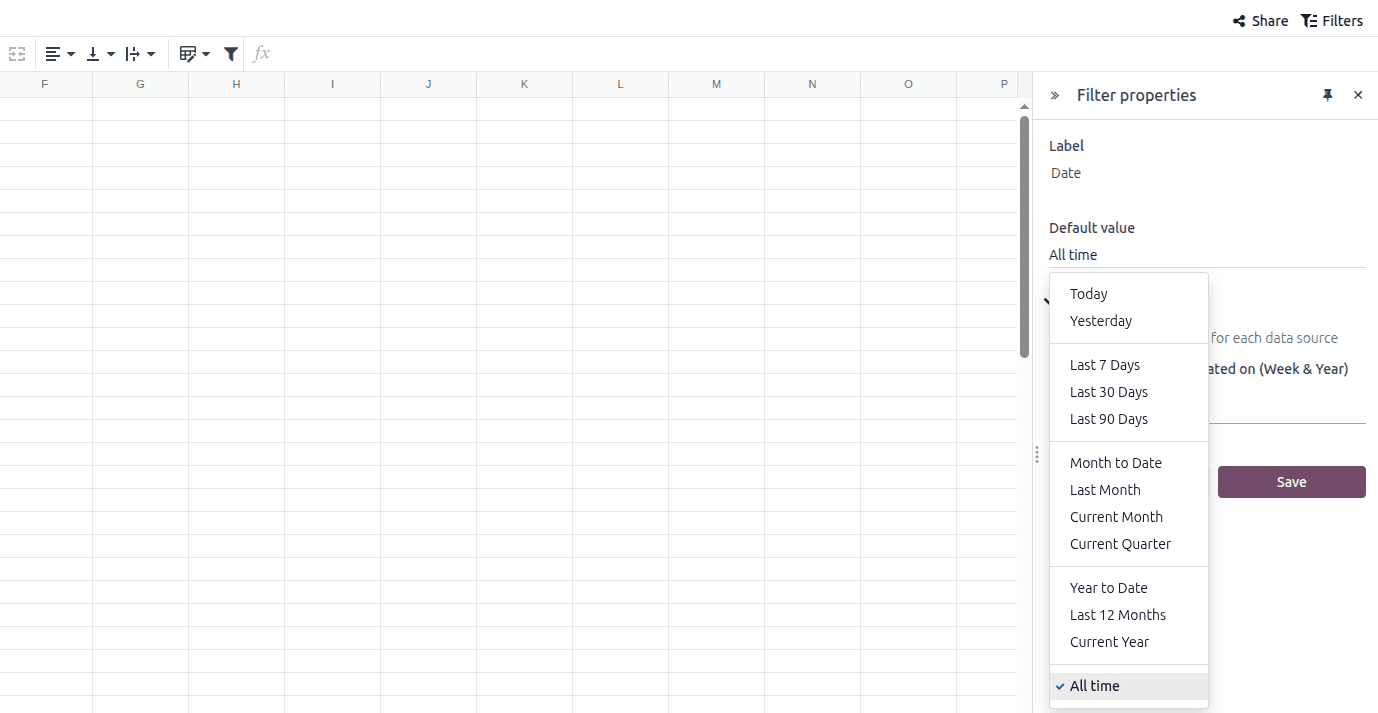
Another global filter that we added was a date filter. Here, you have a lot of options for the period you want to showcase your graphs in.
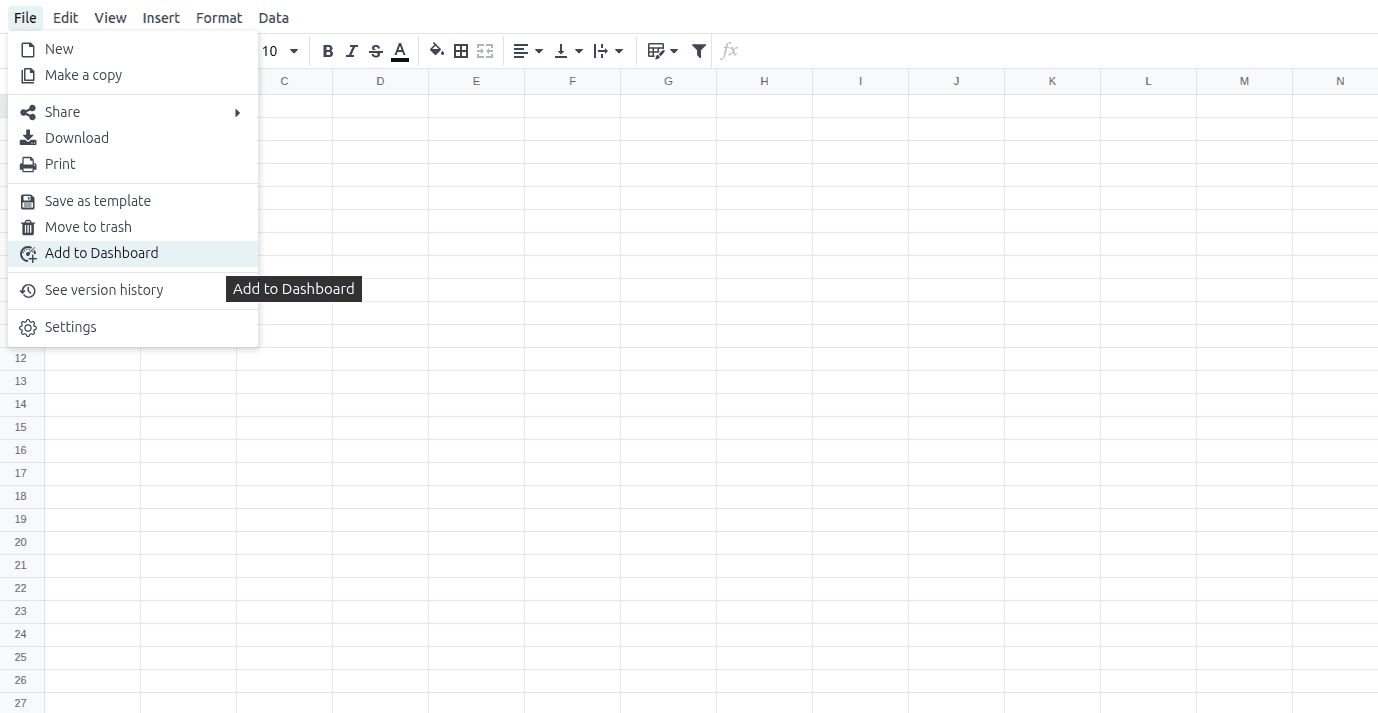
After confirming everything, we added the spreadsheet to the dashboard by clicking on File and Add to Dashboard.
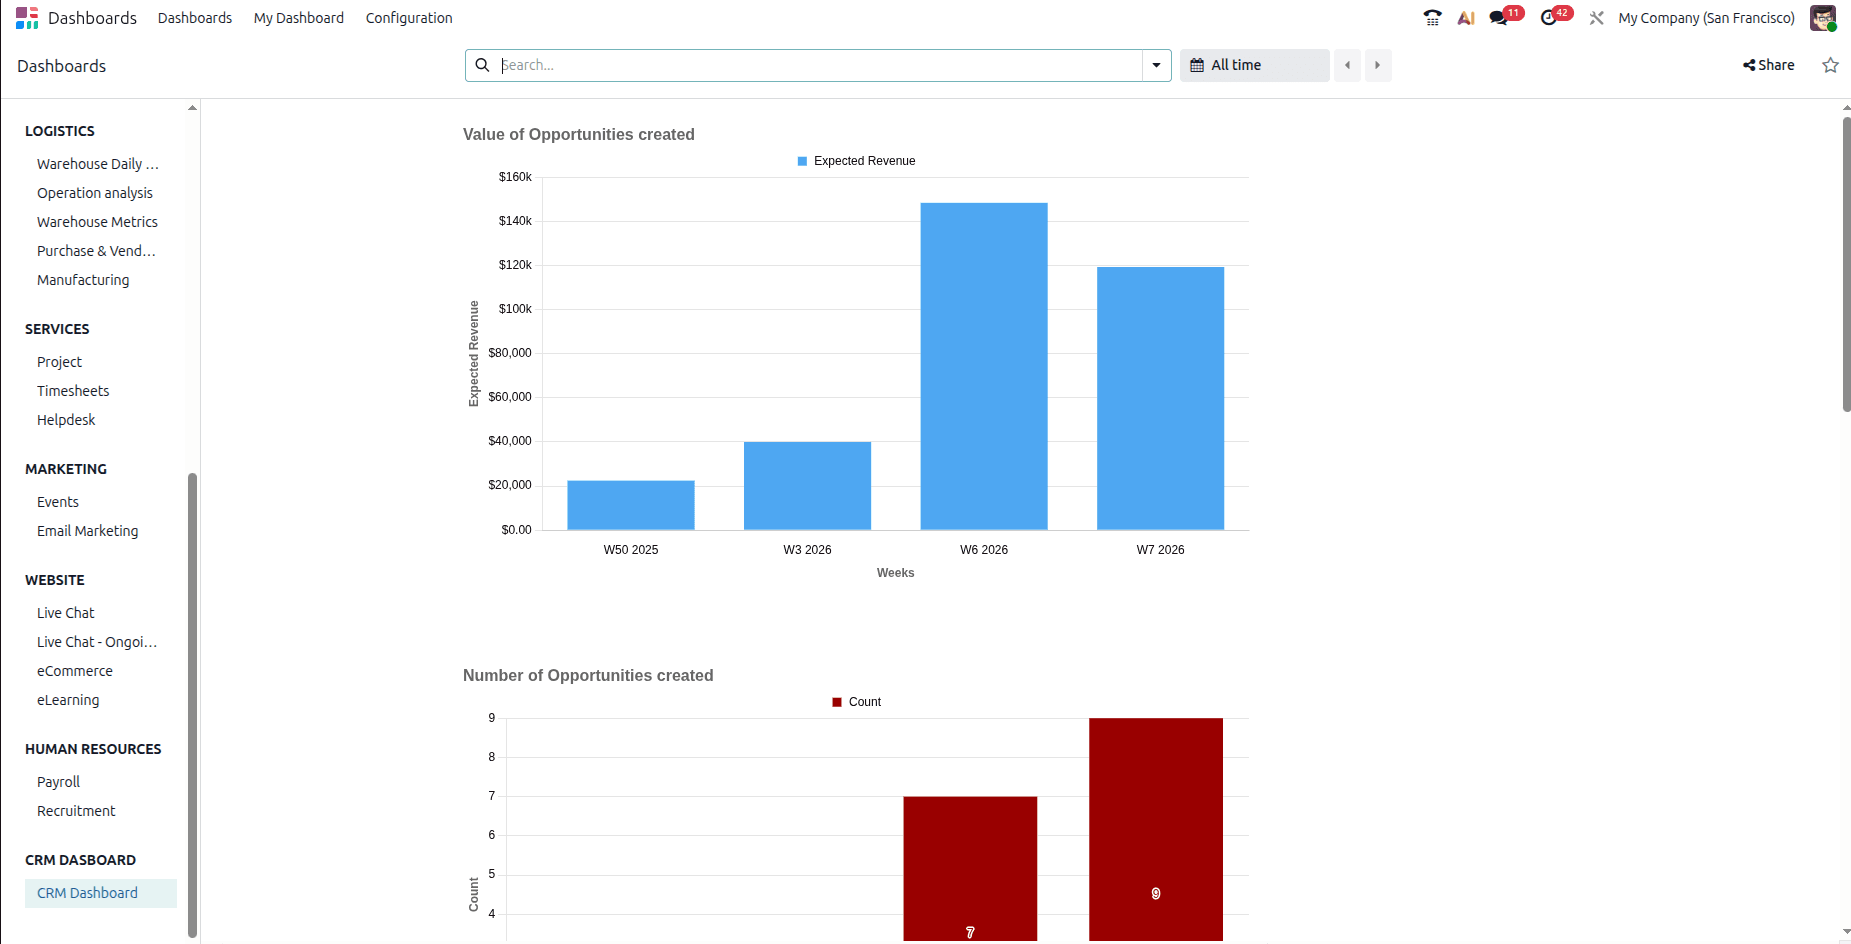
Then, in the Dashboards app, in the corresponding Dashboard, the graphs that we created were displayed. To access the filters, we simply clicked on the All Time button at the top, for the date range, and for the CRM Stages, by clicking in the search bar the filter will appear.
Conclusion
The Dashboard module allows your business to have greater control over how information about your activities is presented. By customizing it in this way, you can create any dashboard according to your preferences.